

Explore
Our products and make
your ideas come alive.


![]()
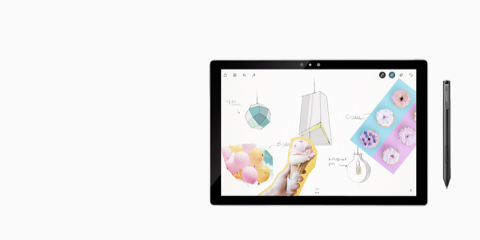
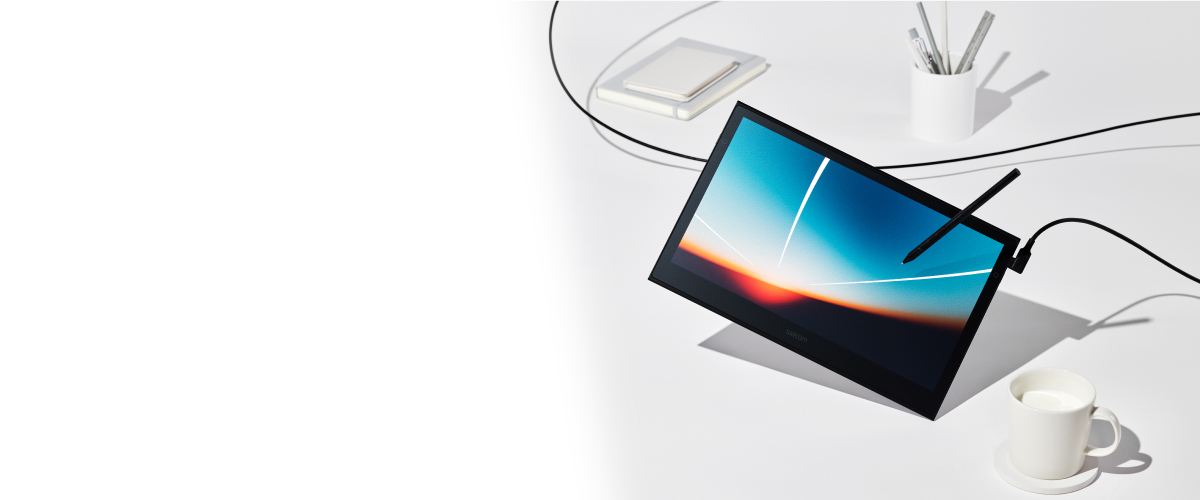
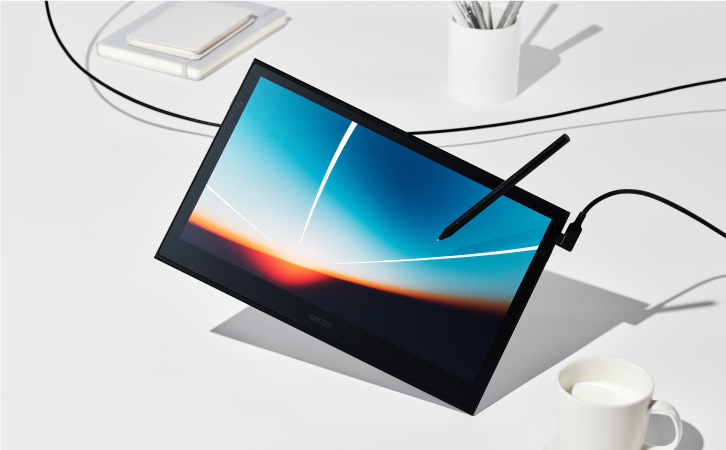
Wacom’s first OLED pen and touch display,
our lightest and thinnest yet.

Breakthrough performance for inspired creativity.
Learn more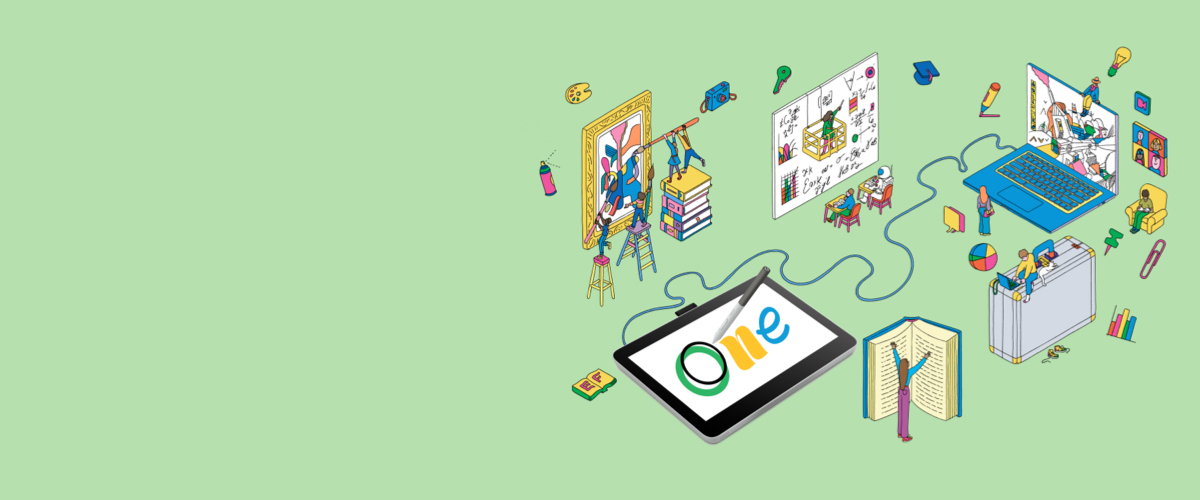
Explore a bold new world of opportunities with Wacom One. As you digitally draw, paint, edit images, take notes, or collaborate, there is no limit to what you can do.
Learn more

Engineered for harmony.
Breakthrough performance for inspired creativity.
Learn more

![]()
These products work with devices capable of running the latest version of Chrome OS and have been certified to meet Google's compatibility standards. Google is not responsible for the operation of these products or their compliance with safety requirements. Chromebook and the Works With Chromebook badge are trademarks of Google LLC. Pen must be used with the tablet to function with Chrome OS.
Learn more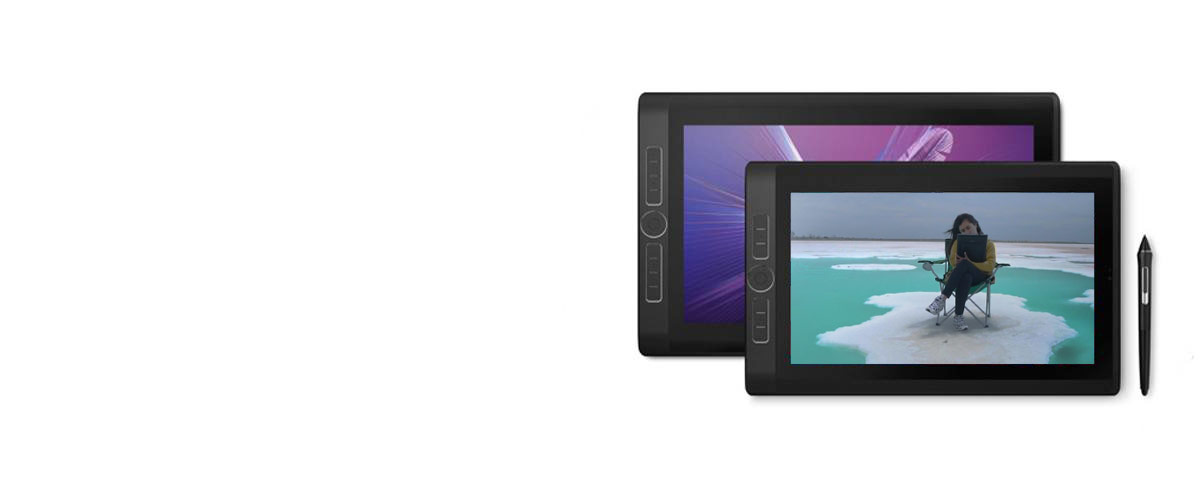
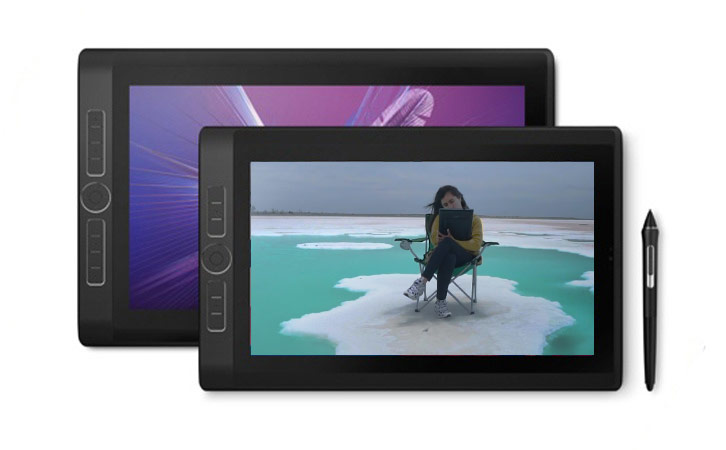
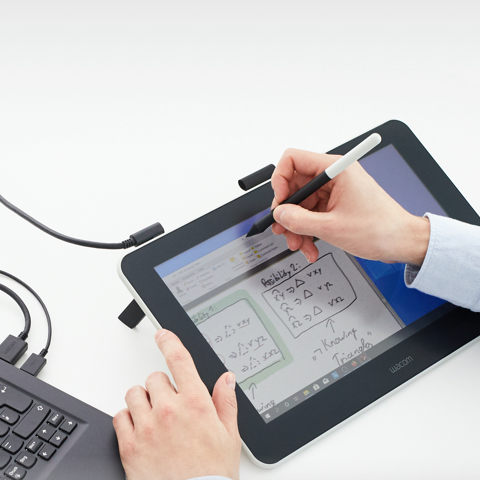
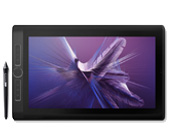
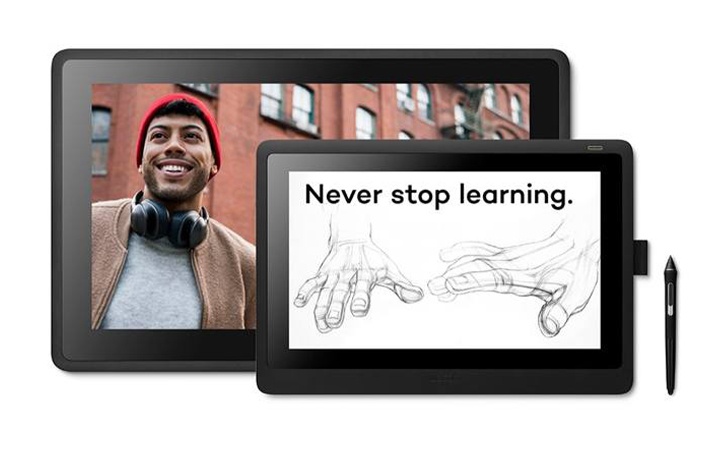
All you love about our pen displays, on the go.
Live. Dare. Create.
Learn more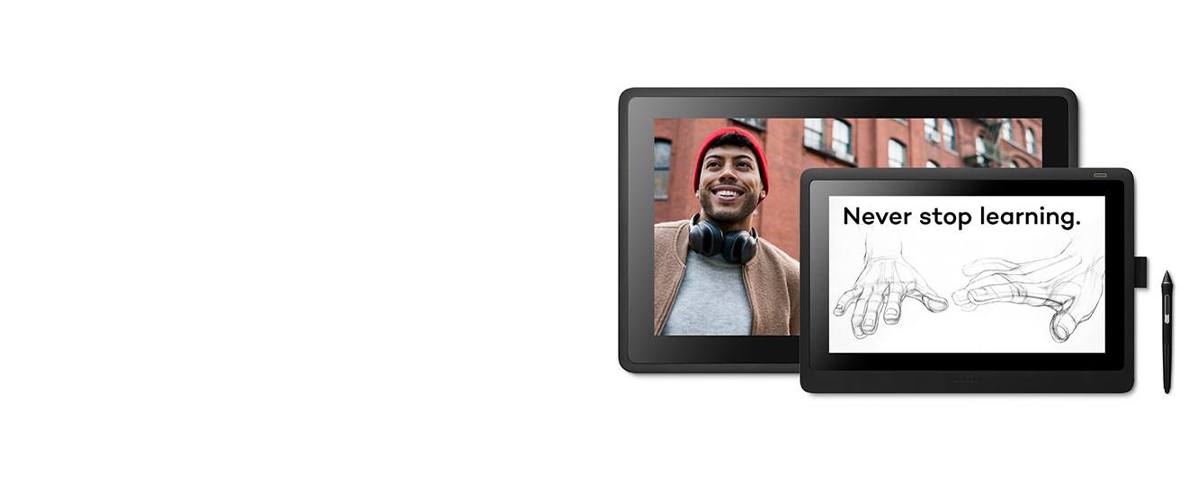
Find your perfect remote ready tools for art students and teachers, eLearning, and remote working.
Learn more about eLearning

Watch free training webinars and online events with prominent artists, designers, and educators.
Learn more about webinars
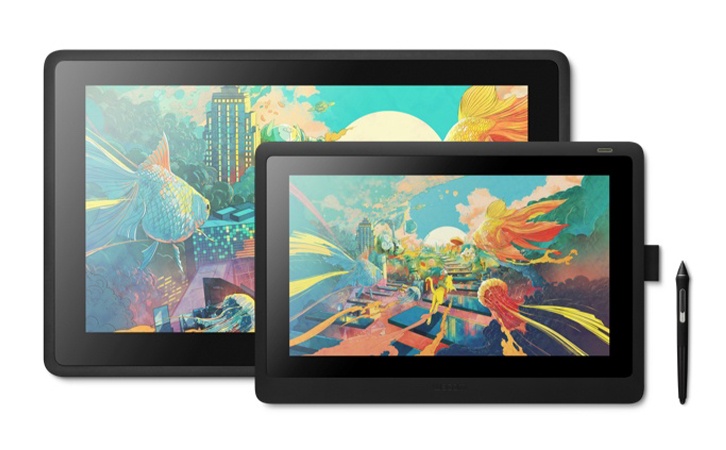
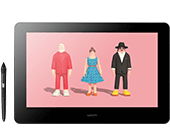
Wacom Cintiq combines pen and display for a truly natural creative experience. Vibrant color, HD clarity, and ergonomic design together with the super-responsive Pro Pen 2, help take your work to the next level.
Limited time software offer: Gain up to 6 months complimentary access to Clip Studio Paint EX
![]()
Live. Dare. Create.
Learn more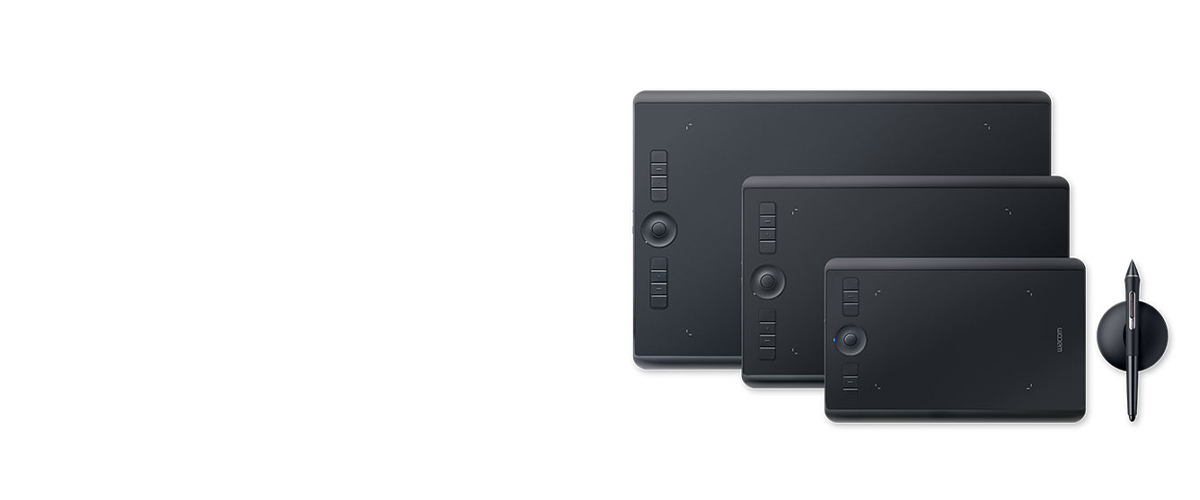
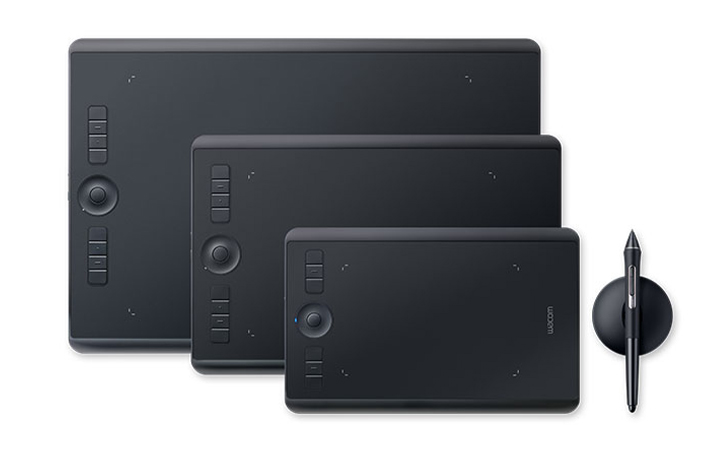
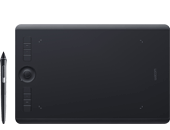
Wacom Intuos Pro offers you more natural creative control than ever before. Combined with the super-sensitive Wacom Pro Pen 2, our sleek tablet looks and feels amazing.
Live. Dare. Create.
Learn more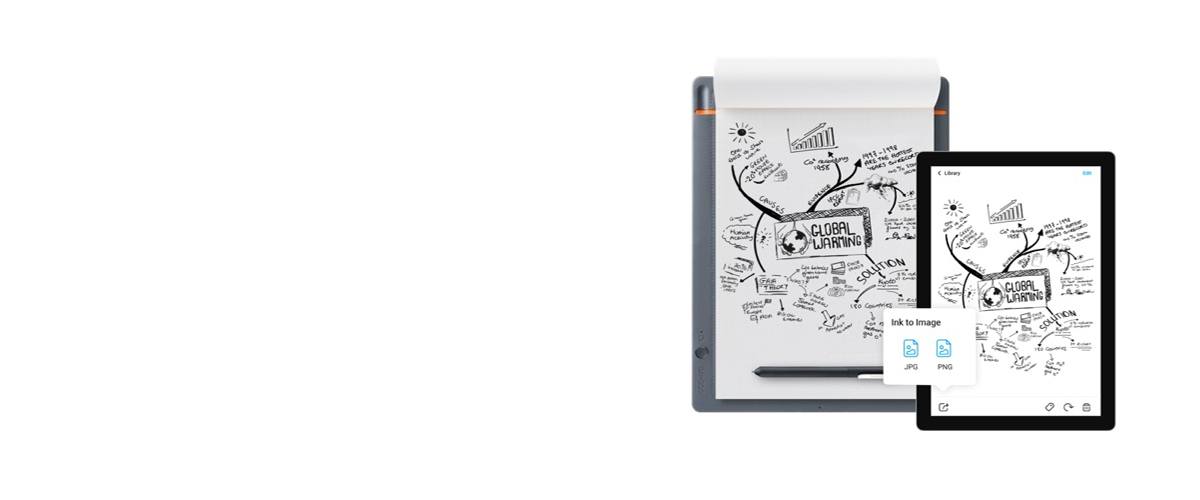
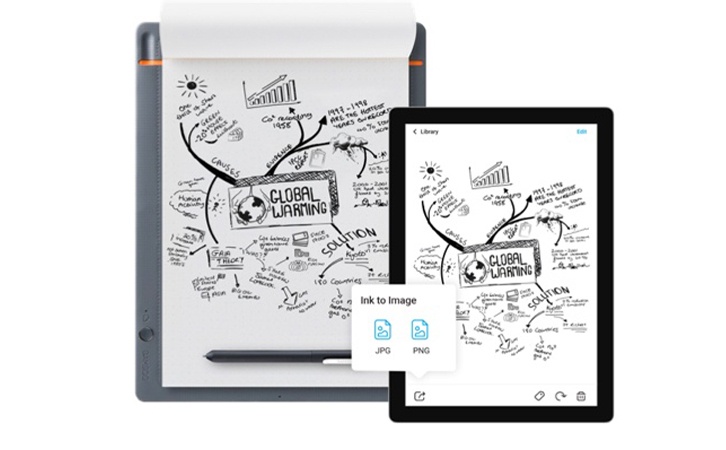
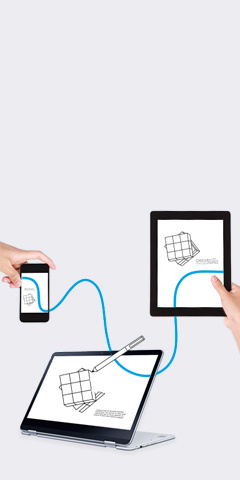
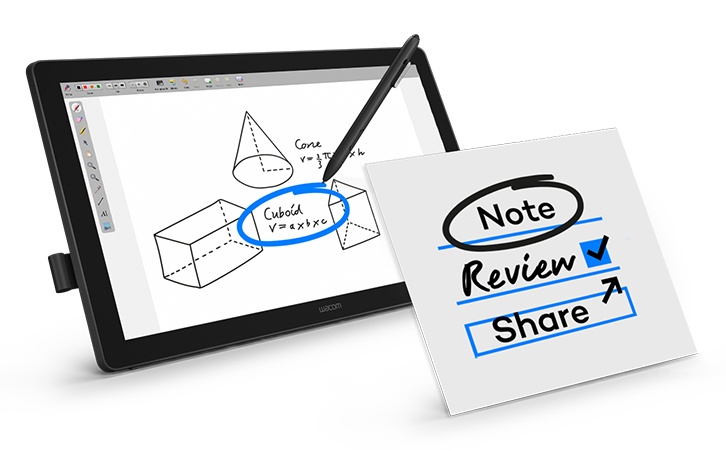
Wacom Inkspace is an app that helps you nurture work created on paper. Inkspace works in harmony with our Bamboo Slate and Bamboo Folio smartpads and Wacom Intuos Pro Paper Edition pen tablet, enabling you to craft, enhance and share ideas more effectively than ever before.
Learn more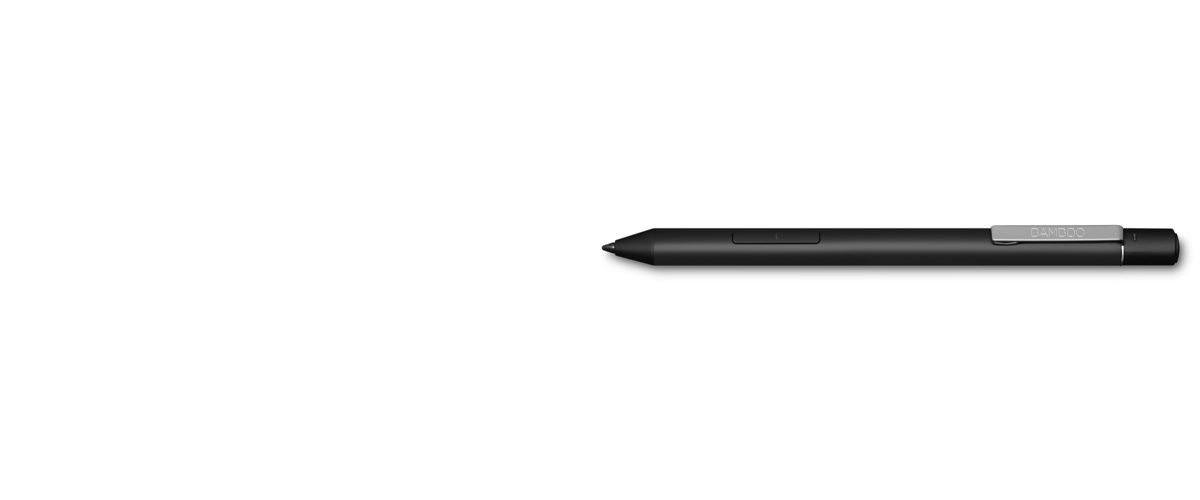
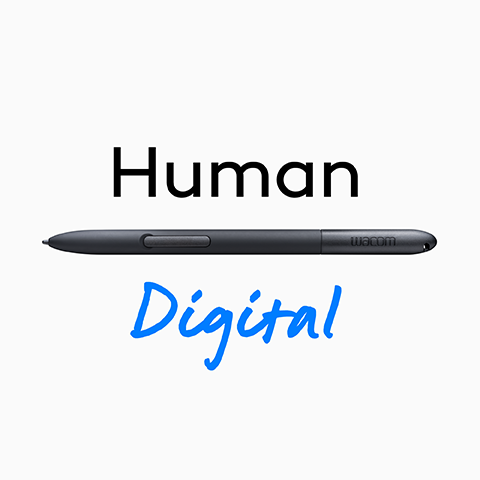
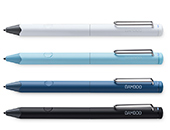
A digital pen with a range of sophisticated and intuitive features, Bamboo Ink Plus is designed to help take your creativity further on screen. Whatever you’re annotating, drawing or sketching – it’s easy to capture your ideas in Windows Ink as naturally as you would do on paper.
Learn more
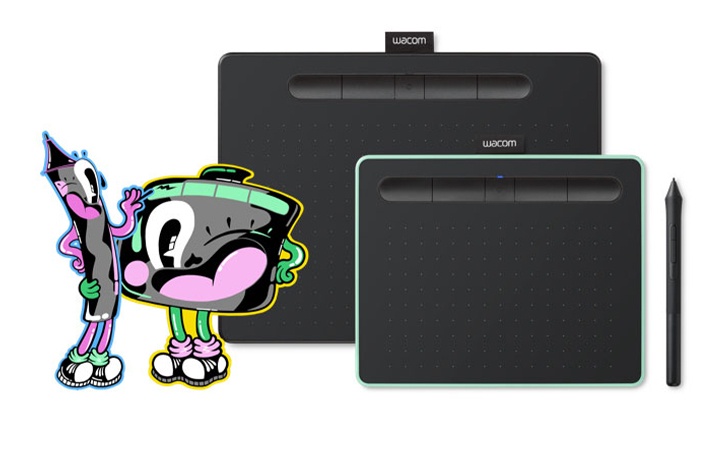
With a light, super-accurate pen and free downloadable software* to suit your style, Wacom Intuos is built to bring your wildest ideas to life.
Live. Dare. Create.
Learn More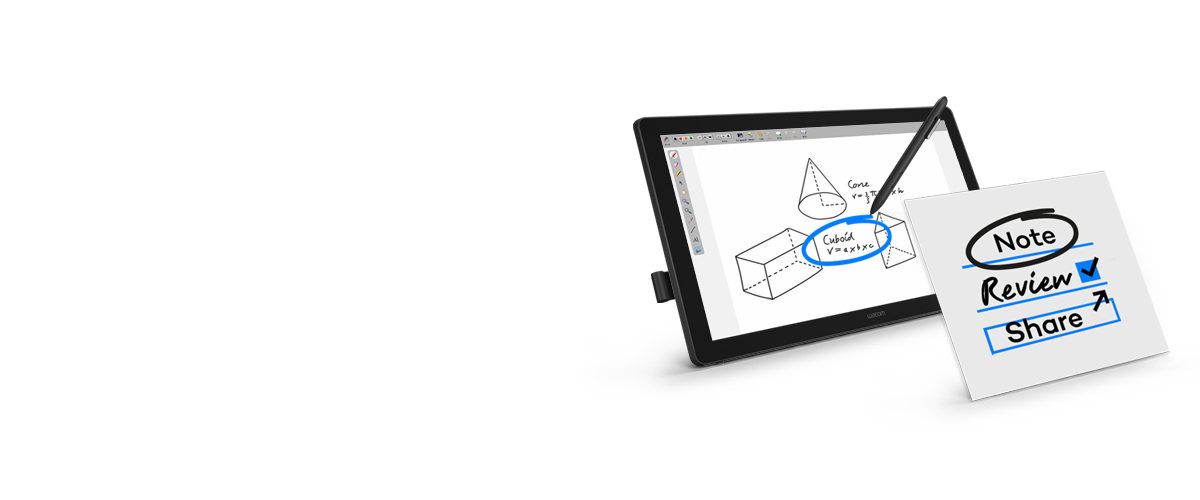
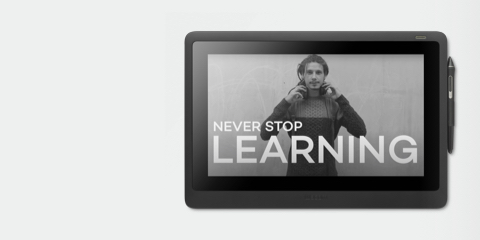
The future of education is digital. Wacom’s 24-inch pen displays provide the perfect canvas for educators to deliver an interactive experience to students.
Learn more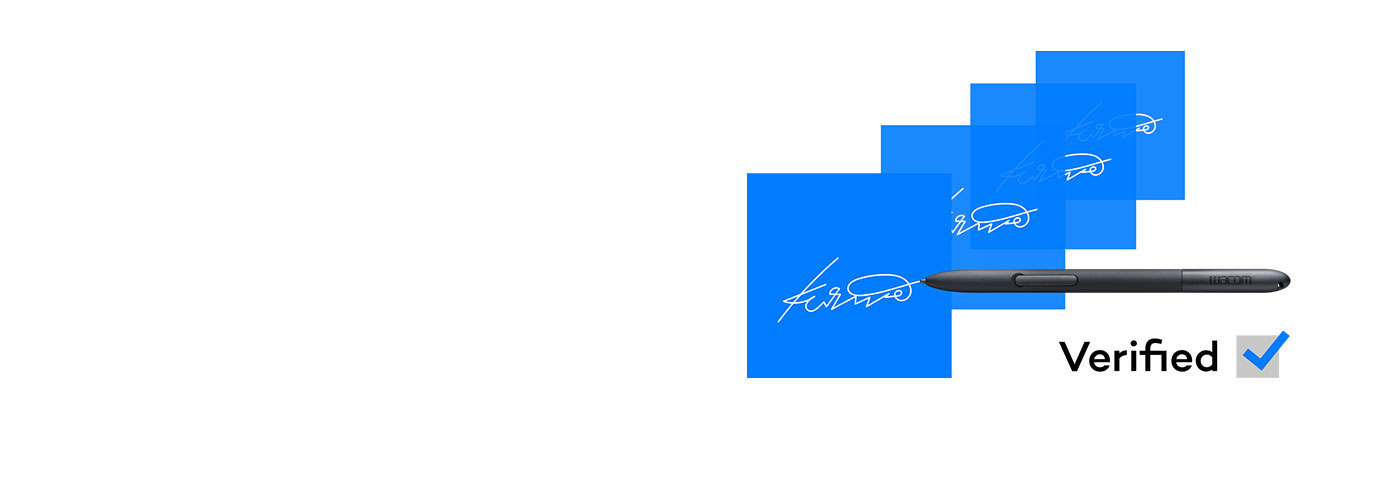

Handwritten eSignatures are the most human way to approve important decisions within a digital document process. But how do you spot a fake? Wacom Ink SDK for verification makes it easy and instant.
Learn more
We have updated our Terms of Use. Click here for more information.